
In the course of the current trends towards Industry 4.0 (smart factory), the availability of as much process information as possible is one of the first necessary steps. Process information, machine control parameter and sensor values are generally available to a large extent, but it is often not easily possible to merge data from different sources or to manage this data from a higher level.
In extrusion lines (e.g. pipe, profile, solid rod, plate) or extrusion plants (blown film, blow moulds) there are usually peripherla systems and sensors with their own control units in addition to the actual main line control unit. This can already be a simple control unit of a heating-station or a winder or haul-off, but also the control unit of measurement systems like of millimetre wave sensors or gravimetry. In some cases, these decentralised control units already have interfaces so that communication with the main control unit is possible. In other cases, such systems operate completely autonomously without the main control unit receiving information from these subsystems.
Industry 4.0 scenarios are based on comprehensive data
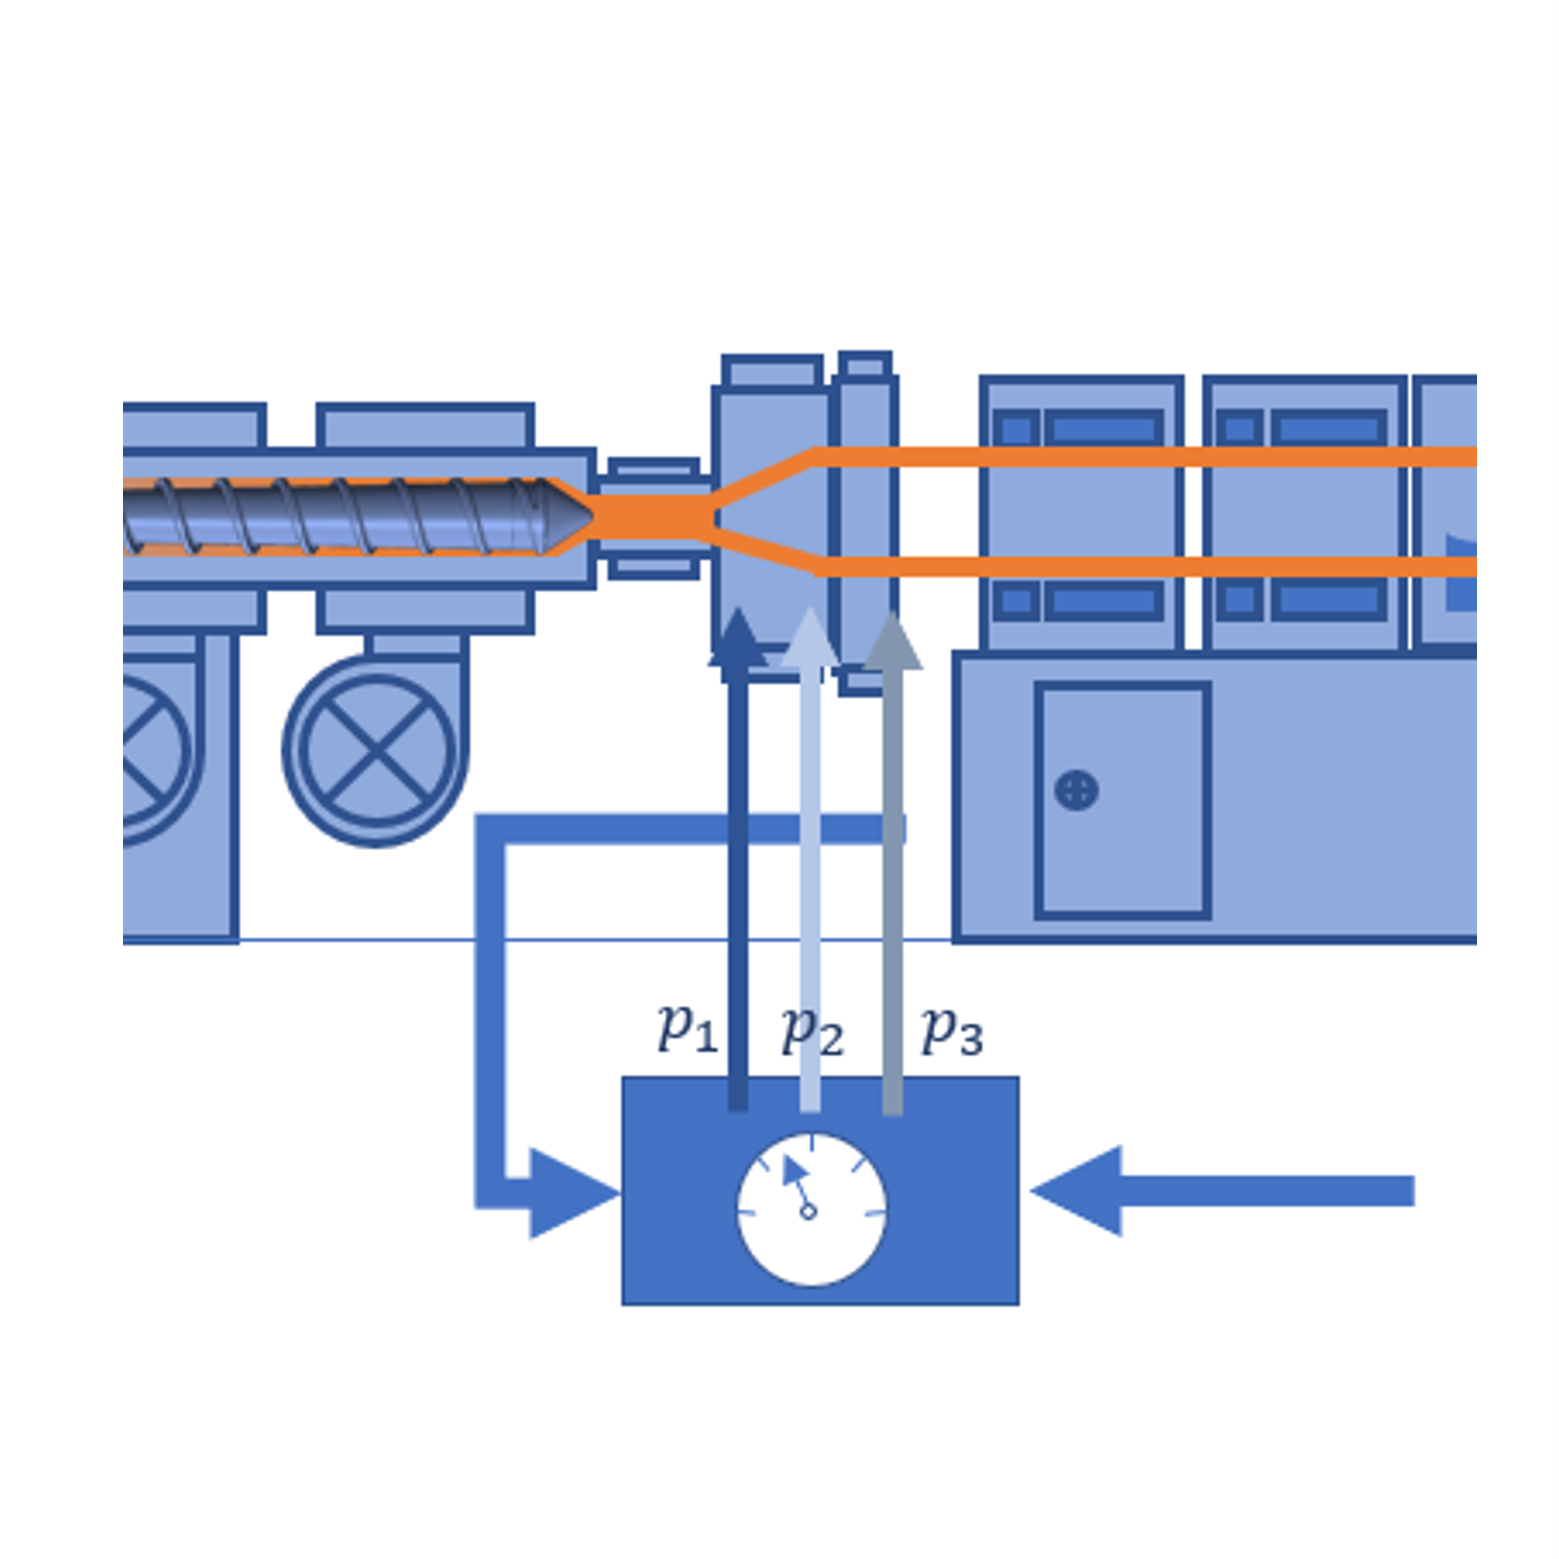
If the entry into the Industry 4.0 age is planned, one of the first steps is to create the situation that all existing data (+ further necessary data) flow together in a superordinate system. The figure above shows the different information flows that can occur in extrusion systems and lines. In a bidirectional information flow, the main controller receives information from a subsystem and can actively access this subsystem through controllers or other algorithms (e.g. by passing on new set points). In monodirectional communication, the information of a subsystem is communicated to the main controller, so that it is able to visualize the information, for example, but there is no feedback of information to this subsystem, This communication path should only be selected if it is a pure sensor system that does not have any action options anyway. The third case (marked in red) represents the situation when there is no information flow at all. For example, the main controller does not know the air temperature of the cooling air, the volume flow of blowers or pumps, the delta T in cooling section segments, etc.
Why is the merging of data useful and important?
Merging data into a higher-level central system offers advantages, such as:
- Avoidance of walking distances and time delay (e.g. reading values on galleries or at the end of the line)
- Visualization of information that can assist in the parameterization of the process
- Possibility of creating overarching regulations
- Troubleshooting support, as correlations and interactions become more easily visible
- Data storage “fingerprint” of process parameters, traceability of production data
- Use of data evaluation system that go beyond the capabilities/possibilities of machine control
- Prerequisite for the implementation of virtual assistance systems

In order to be able to merge data, the following questions must usually be answered beforehand:
- Where does the data come from?
- How are the data available? What kind of signal is used (e.g. 0-1V, 4-20mA signals) or digital values?
- Which protocol is used for data communication? A protocol is the “language” in which two systems do communicate. Both systems must speak the same language to enable communication (ModBUS, CAN, EtherCAT, Profibus, etc.)
- Which hardware interfaces are used by the systems to be connected? (Hardware interfaces are nowadays mostly Ethernet (LAN) interfaces, but in some cases also serial interfaces or other systems. However, many different “protocols = languages” can be communicated via an Ethernet hardware interface.
- Do the built-in sensors, actuators or the controller use proprietary protocols or interfaces? (Proprietary interfaces are coded by the owner in such a way that the interface can often only be used by the manufacturer. Sometimes this is used as a means of customer retention, since in such cases only the same hardware can be purchased for system expansions.
- How many different signals are to be read out?
- What is the sampling frequency of the individual signals?
System description based on practical and everyday example:
Initial situation:
An extrusion line has a machine control unit that is about 8 years old. A lot of information are already available in the control system and can be visualized there. Peripheral systems such as temperature control units or winders can also be controlled. However, the data from these devices are only displayed in the controller and not used for internal control loops. The machine manufacturer does not grant access to the “program” of the machine control, so changes and extensions to this system are only possible by the machine manufacturer. The machine manufacturer has already been asked, but refers to the purchase of a new and modern machine control system with better communication options.
Target:
The information gathered in the extruder control unit is to be supplemented by further data that have not yet been measured (environmental data such as hall temperature, thermal influence on the extrusion environment, cooling parameters) and higher-level evaluation algorithms shall be used to to evaluate the data live. The current process parameters of the plant and other information from the ERP system (personnel deployment on the line, sales prices) are used to calculate the production costs in € per meter of extruded product. In addition, further subsystems which have their own controls and do not communicate with the main plant control system are also to be evaluated by a higher-level system.
Path of realisation:
First, the machine control of the main control unit is considered. Many different analog signals are already available there and are converted into digital signals in this PLC. The machine control (in this case from the manufacturer Siemens) offers the possibility of communication via the ProfiNET protocol via Ethernet interface. An interpreter (in this case a plusMETER bridge) is used to read out the information available in the machine control system. The interpreter establishes communication with the machine control system (in ProfiNET) in the network and communicates simultaneously with other systems in the language (OPC UA), as well as writing a database in the standard format MS SQL. Thus, all information that the machine control unit “knows” are now available both via the OPC UA language and as digitally stored information in an SQL database.
In the second step, additional sensors are to be integrated into the system, which will be installed subsequently. To integrate these sensors directly into the main control of the machine, reprograming and extension of the machine control by the manufacturer would be necessary. Therefore, an alternative path is selected and all additionally recorded sensors are recorded by a second PLC (e.g. a plusMETER or an alternative controller from B&R, Siemens, etc.). This second controller does also communicat all information via the Ethernet interface, e.g. in TCP/IP or directly in OPC UA format.
In a third step, data is also to be read from a air blower and three other peripheral systems, each controlled by its own small PLC (from different manufacturers). Since the communication takes place via different protocols (Ethercat, Modbus), but the hardware interface is again the Ethernet interface, the readout of these four PLC systems can also take place via the same interpreter (plusMETER Bridge) as the readout of the main machine control. This only requires the activation of the communication features for the other protocols (Ethercat and Modbus).
A software system is used to consolidate all data, which not only stores and sorts the collected data, but also enables its visualization or evaluation at the same time. Various software systems exist on the market and offer different advantages and disadvantages.
Since all production data (shop floor) are now available in a central database (with a standard format), the company’s IT department can link the data from production with the data from the ERP system using simple database queries. In this way, extensive links can be mapped, which can be displayed in the ERP itself, as well as visualization systems in production can provide live information about current productivity and manufacturing costs.
The schematic diagram of such a situation (implemented with components from the SHS plusWARE® family) is shown below. Of course, there are also other hardware solutions available.

Basic possibilities to retrieve sensor data from production
- If the sensors are connected to a controller, it is possible to read the information from the controller via the above-mentioned path with a bridge. This is particularly recommended if a large amount of sensor data is to be read out
- If only individual values need to be read out, it is often possible to “monitor” the sensor signal on its way from the sensor to the controller. The controller does not notice that other systems receive the same information and continues its service. However, such signal splitters are comparatively expensive and are not suitable for all signals.
- Additional sensors: in some cases it may make sense to install additional sensors and evaluate them via a separate system.
If you are interested in further information or if you want to be kept informed about new articles, please register for our newsletter and our free download area.


