
Identifying the “real” cause of a problem is usually the most important step if a sustainable solution is to be achieved. Often fundamental mistakes are made in this area and either “workarounds” are developed which merely help to avoid the problem or fake causes are eliminated. Various methods exist for the strategic approach. This paper deals with the use of cause and effect diagrams (Fishbone, Ishikawa) and the use of the 5Y method (5W).
Identifying the real cause of a problem is the decisive step in permanently avoiding a problem and building up know-how. The cause of cause-effect diagrams is a proven method.
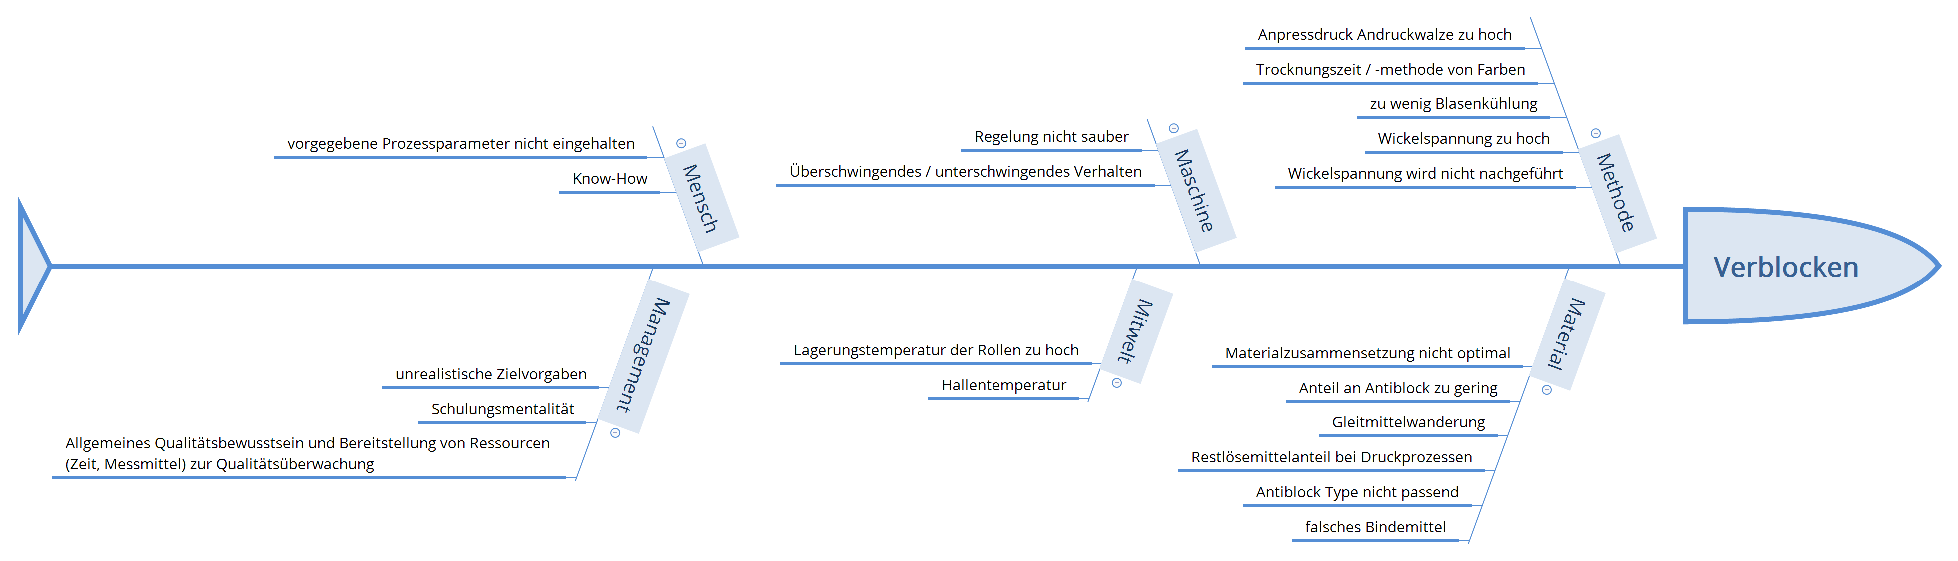
In a cause-effect diagram – or fishbone diagram – the problem is written in the “head of the fish”. All conceivable causes that could have contributed to the problem are drawn on the head as fishbones. The different causes are categorized and sorted. The 6M method has proven itself as an easy to use order structure. The problems are divided into the 6 categories beginning with “M”: manpower, method, machinery, management/measurement, material, mother-nature.
A lack of employee qualification that led to a low quality production would therefore have been caused in the categories of people (lack of know-how) and in the category of management (inadequate advanced training planning).
Teamwork has proven to be the best way to determine the possible causes of errors. We recommend a heterogeneous composition of the team (cooperative engineering), i.e. the participation of experts from different areas (e.g. management, operations management, shift supervisors, plant operators, maintenance, electrics or in another case: design, development, sales, purchasing). Only by involving different people an objective view of the problem is possible and issues that may be (e.g.) completely hidden to a business manager can be taken into account by an shift supervisor. It is recommended to create the diagram with computer-aided methods, as this allows almost any extension of the diagram without having permanently affix new sheets or start the drawing on the white board from the beginning.
(Note: The Fishbone diagrams in this article and the additions in our free download area are created with the software XMind. XMind is available in a free version and offers many important functions for creating fishbone diagrams, organization charts and brainstorming models in simple and intuitive operation.)
The created diagrams represent a kind of knowledge database of the company and contain many important ideas and interrelationships. For this reason, the diagrams should be saved and continuously developed. Ultimately, once a fishbone diagram is created, it is an important database of information and – the more detailed it becomes – the more it can be used as a tool to solve new problems.
Addition of the 5Y method to the cause – effect analysis
In a second step, the addition of the 5Y method to the cause analysis has proved very successful. This ensures that no fake causes are eliminated, but that the real causes of the problem are actually eliminated.
We explain the 5Y method in a follow-up article.
If you would like to be kept informed about updates and new articles on this page, you can register for our newsletter and you will also recieve access to our free download area.


