
When extruding profiles, the maximum production speed is one of the most important factors for the calculation af a quotation. If the production speed is assumed to be higher than the real production can be in practice, this can mean high losses for the extrusion plant and represents a high economic risk.
Nowadays, manufacturers of extruded profiles are very often contract extrudeurs and receive requests from their customers for the production of special profile geometries.
The first steps of the extrusion plant are then usually:
- the analysis of the feasibility of the profile,
- the calculation of the achievable extrusion speeds and based on this
- Calculation of the cost of goods manufactured or determination of the offer price
The extrusion company must therefore provide the customer with a binding sales price in €/m product, even before the production of the extrusion die and the calibre is done and before the line is run in or the product is sampled. To calculate this price, the reliable determination of a realistic production speed of the profile is one of the most important factors determined by the profitability of the entire job.
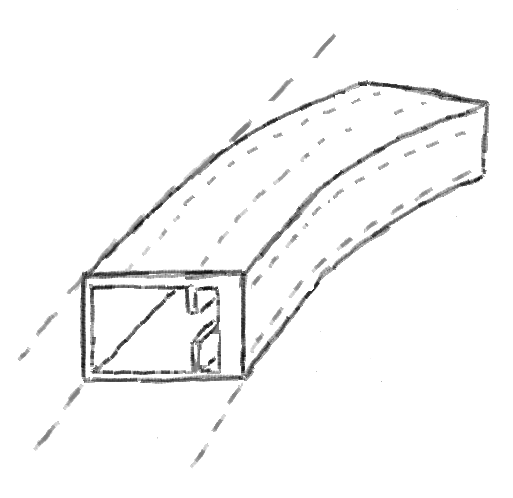
However, calculating the maximum production speed is not an easy step, especially when complex hollow chamber profiles are involved. Internal areas of the profile cannot be actively cooled and the air chambers insulate the internal areas very well thermally. This in combination with the already very low thermal conductivity of plastics leads to sometimes very long cooling times or to only low possible line speeds.
Due to the complexity of the profile geometries, even experienced designers and extrudeurs regularly reach their limits in such a design task, since the thermodynamic situation is hardly calculable analytically.
Exactly for such tasks (and many others) the module profileSIM of the chillWARE cooling simulation was developed, the use of which shall be illustrated in the following by means of an example profile (exemplarily carried out on a window profile drawing of the company Aluplast / IDEAL 8000 freely available in the net):
1. The request for an offer is usually made by sending a drawing of the desired profile cross-section as a two-dimensional drawing file.
2. This sketch of the profile geometry is imported into the chillWARE cooling simulation and the boundary conditions of the individual simulation areas are defined. The program automatically recognizes the profile area, the outer boundary of the profile and the different internal hollow chambers and parameterizes these with typical values. Of course, the boundary conditions can be adapted at any time on the basis of our own wealth of experience.

Illustration: Automatic recognition of profile geometry and automatic parameterization of boundary conditions
3. After importing the geometry and setting the boundary conditions, the automatic meshing algorithm of chillWARE is activated, with which the profile geometry is discretized into a finite element mesh (tetrahedron). User intervention allows the maximum element size to be adjusted, as shown in the figure below. If the default settings are retained, the system automatically selects an optimal element size based on the geometry data.

4. The next step in defining the production parameter is to select a plastic material from a material database contained in the program. For all material types stored in the software, the complete thermodynamic characteristics (for the cooling process!) are stored from our own laboratory measurements. However, the user can extend the material database independently at any time. The data stored in the software contain at least the thermal conductivity of the material, the density, the specific heat capacity and the enthalpy as a function of temperature as well as other values such as the modulus of elasticity, the coefficient of thermal expansion, etc. in scalar form.

Illustration: Example of a material model from the chillWARE material database
5. In the next step, a virtual copy of the cooling section of the production line is created. A virtual cooling section is created from a library of standard elements and by defining the variable parameters like real cooling water temperatures and segment length. The standard library has all systems used on profile extrusion lines, starting with different calibres, immersion and spray cooling tanks up to haul of units, saws or special heating stations (IR, gas, etc).

6. Starting a single simulation or automated execution of an iterative optimization
The thermal process situation of the defined project consisting of the partial definitions (material, geometry, process, cooling section) is now calculated and graphically visualized by the chillWARE 3D Engine.
The results include the complete thermodynamic situation of the profile at any point within the cooling section and at any point within the geometry. The results are displayed in diagram form, as a color contour plot or as an animation of the cooling situation, whereby particularly relevant areas (e.g. the hot spot or the cold spot) are automatically determined and displayed in the graphic in the individual display types.
In addition, the cooling gradients are displayed in the form of variable-length arrows (length represents the gradient value) and three-dimensional diagrams to improve the visualization of special partial results.
Naturally, the typical functions of rotation, pan, zoom in, zoom out and the axes can be scaled are available in all result displays.

Figure shows calculation results of profileSIM (calculation time approx. 35 seconds)

In addition, automatic optimization systems offer the possibility of iteratively carrying out several simulations with the specification of a target value, whereby individual production parameters are varied until a target value can be achieved.
Looking back on the introduction and the title of the article, an optimization calculation in the following style would be possible:
Determination of the maximum production speed
Specification: geometry, material, available cooling section
Critical value: Hot spot temperature at the saw
Procedure:
The chillWARE simulation calculates the temperature distribution of the profile in the area of the saw for a start production speed and determines whether the maximum temperature is above or below the critical temperature. If the critical temperature has been exceeded, the cooling parameters (e.g. water temperatures, supporting air, etc.) are adjusted to achieve the desired production speed. If these measures are not sufficient, alternative production parameters (e.g. realistic line speeds) are determined. If the critical sawing temperature has not yet been reached, the algorithm increases the process parameters so that optimum productivity and process economy are the result.
Summary
Based on thermodynamic simulations of profile cooling, a large amount of valuable information can be determined which helps to improve the understanding of the process, to carry out calculations realistically and to avoid production problems (residual stresses, bowing, deformations, shrinkage of profile points, etc.).
This link takes you to a video animation of the shown profile geometry:
If you are interested in further information and free download materials or would like to be informed automatically when new articles appear, please register for our internal area and newsletter.
https://www.youtube.com/watch?v=p_SzMW_7k9s
(The chillWARE cooling simulation is a computer simulation software from SHS plus, based on the finite differences and the finite element method, which was specially developed for use in extrusion plants. The software was awarded the title “Product of the Year – 2nd place” twice in a row by the plastics processor in 2016 and 2017 and is used internationally by plastics processors and machine builders. If you are interested in a personal introduction of the system, please contact us.)


